Introduction
A lot has happened since my last post (and really, I mean A LOT). However, in the spirit of that last post, one good thing that has happened is that in the upcoming 1.3-0 release of the oce package on CRAN we have changed the default colormap (or “palette” as it’s often referred in the R world) to something not nearly sucky as the classic “jet” colormap (originally made popular by Matlab).
The purpose of this post is just to highlight the difference between the old and new defaults, and also to show many other great colormaps for plotting oceanographic data.
Jet vs viridis
When the imagep() function was first added to oce, there was a limited selection of palettes that could be used. For a long time, the default of the imagep() function itself has been a palette called oceColorsPalette() (which is a blue-through-white-to-red palette most useful for diverging colormaps), however many of the internal functions that use colors defaulted to the oceColorsJet() palette, including: the plot,section-method, and more importantly, the colormap() function itself (which I wrote about here).
library(oce)## Loading required package: gsw## Loading required package: testthat## Loading required package: sf## Linking to GEOS 3.8.1, GDAL 3.1.1, PROJ 6.3.1data(volcano)
par(mfrow=c(1, 3))
imagep(volcano, col=oceColorsPalette, main='oceColorsPalette()')
imagep(volcano, col=oceColorsJet, main='oceColorsJet')
imagep(volcano, col=oceColorsViridis, main='oceColorsViridis()')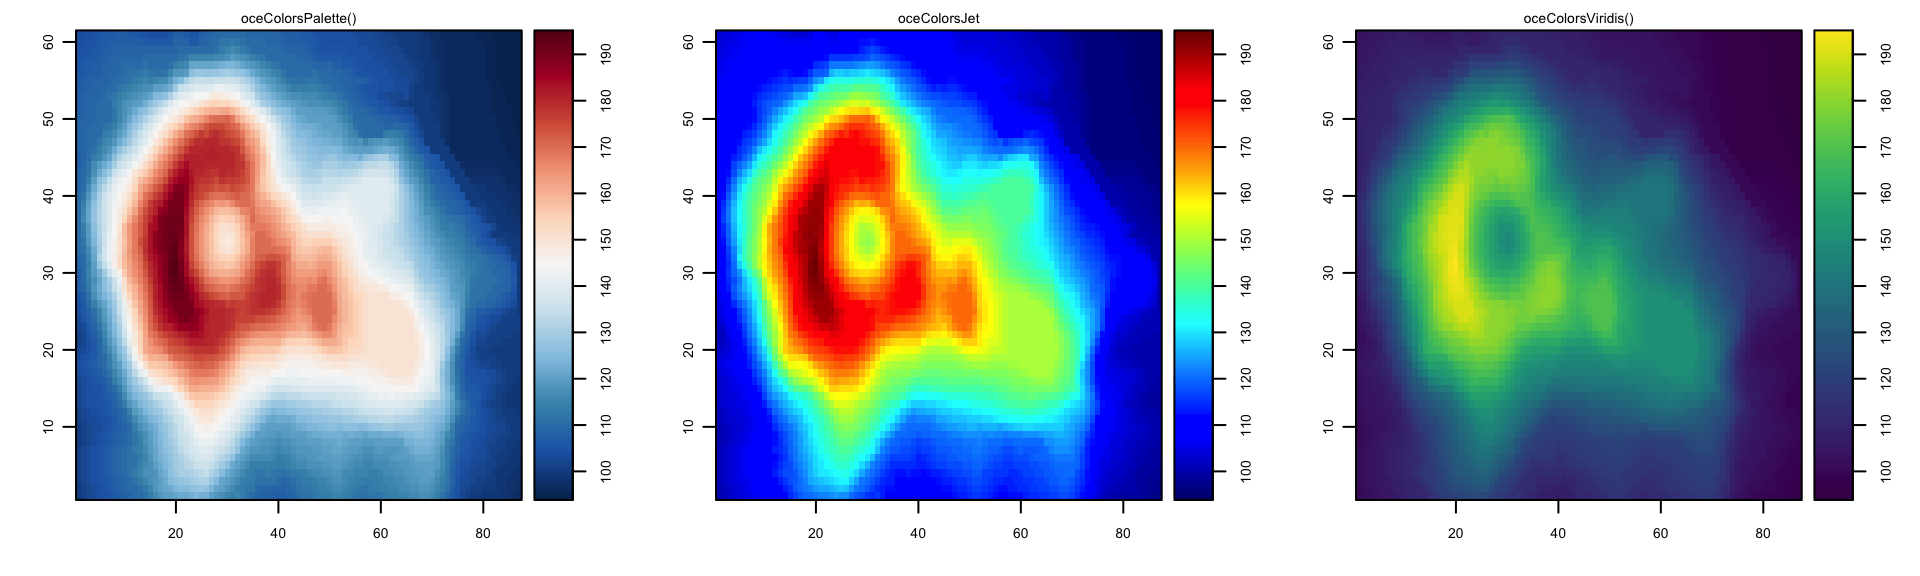
The palette on the left, oceColorsPalette() has been retained as the default for the plot,adp-method (is velocities are typically diverging). The palette in the middle, Jet, is still available but is no longer the default for any plots. The viridis palette on the right is now the default for all palette-related functions.
I won’t go into the details of why viridis is so much better – a quick google will turn up lots of articles (though this new paper from Kristen Thyng has lots of great info.
Other, even better palettes
Kristen Thyng is author the author of the cmocean series of oceanographic colormaps, originally created for python/matplotlib. There is now a cmocean package on CRAN, which makes all the python colormaps available in R.
library(ocedata)
library(cmocean)
data(levitus)
par(mfrow=c(1, 2))
with(levitus, imagep(longitude, latitude, SST, col=cmocean('thermal'), main="sea surface temperature"))
with(levitus, imagep(longitude, latitude, SST, col=cmocean('haline'), main="sea surface salinity"))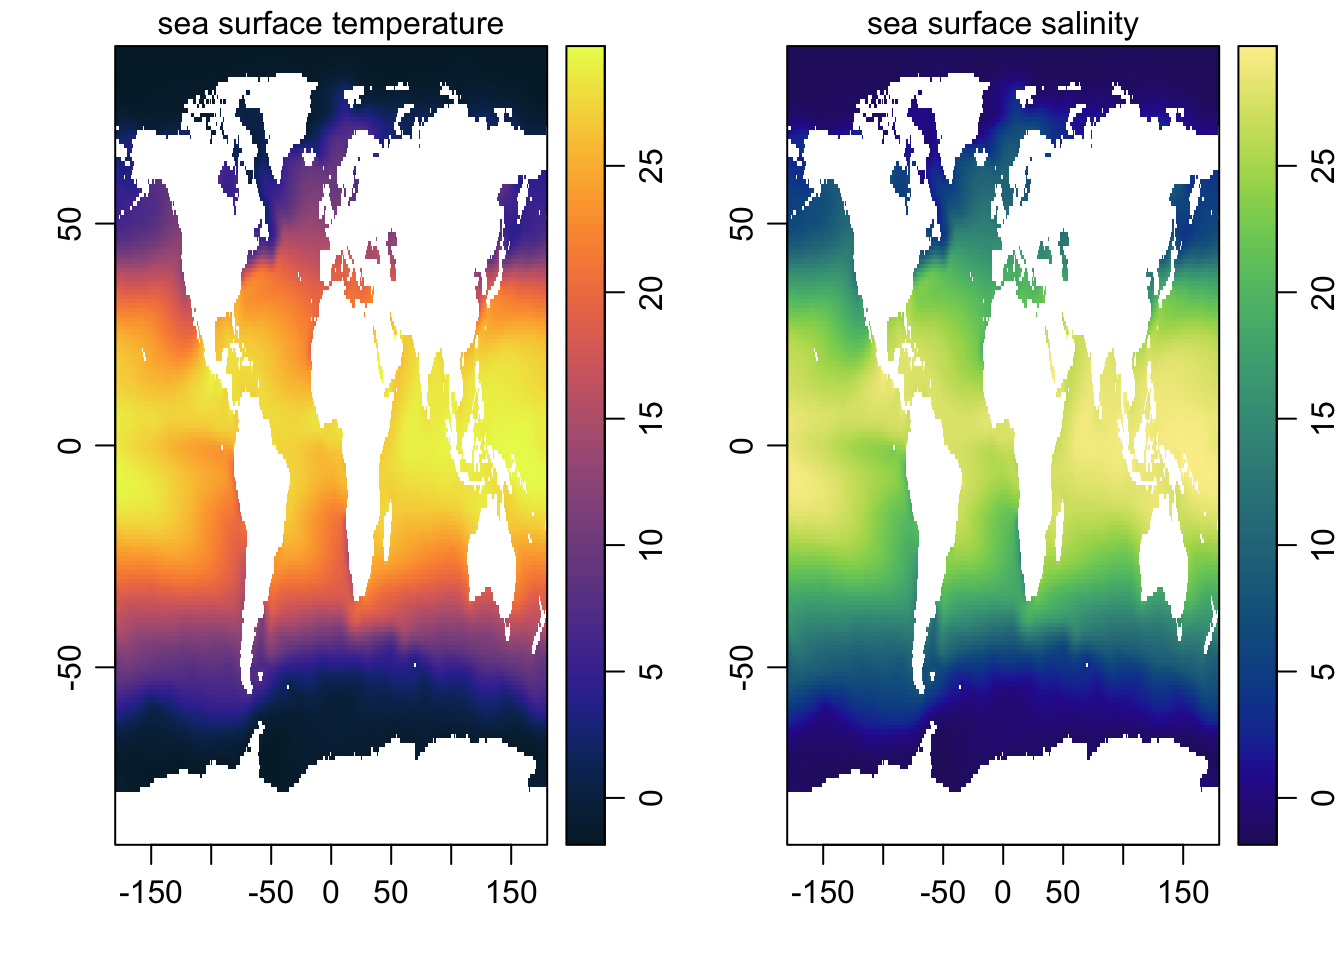
There is also the viridis package itself, which makes the series of palettes developed for matplotlib available in R.
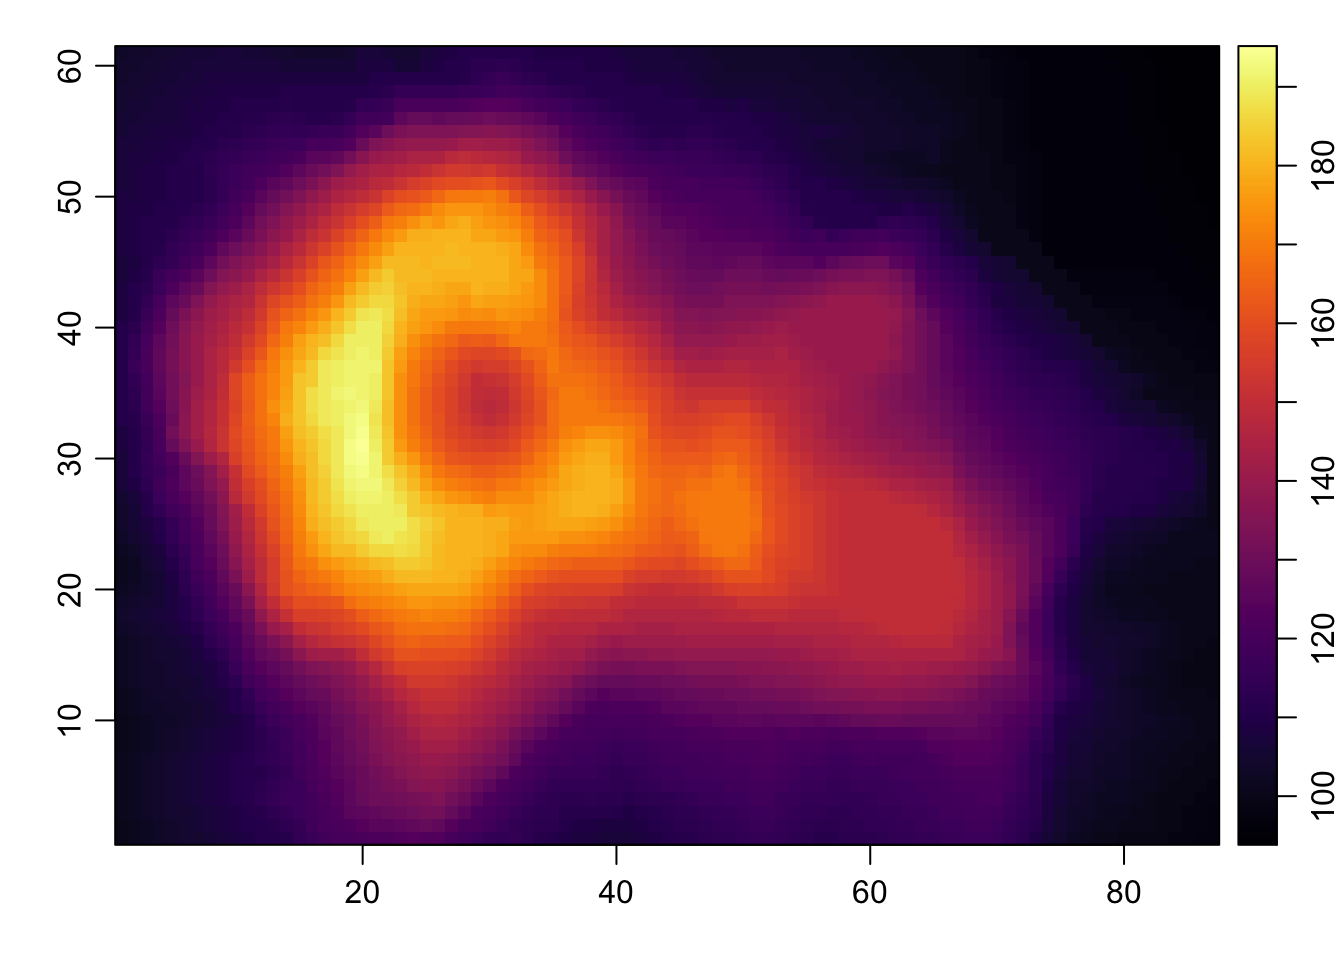
library(viridis)## Loading required package: viridisLiteimagep(volcano, col=inferno)