
Introduction
There is a recent trend in places like Twitter to include in your bio the atmospheric CO2 concentration when you were born. I like it, since it is both a neat measure of the range of ages of people that you can interact with (without being really about age per se), and also since it is a sobering reminder of just how much damage we as a species have done in a very short amount of time.
Anyway, there’s nothing overly complicated about figuring this out – probably a simple Google search would be enough to tell me what the atmospheric concentration of CO2 was when I was born. But where’s the fun in that? :)
The R co2 dataset
Handily, R comes bundled with an example dataset called co2 (as an examples of a “time series”, or ts object), which contains monthly measurements of CO2 from the Mauna Loa observatory from 1959 up to 1997 (I wonder if we can get the R core team to update this dataset for the last 20 years ….).
My birthday is September, 1979, so let’s see where that lands on the curve:
data(co2)
plot(co2)
grid()
abline(v=1979+9/12, col=2)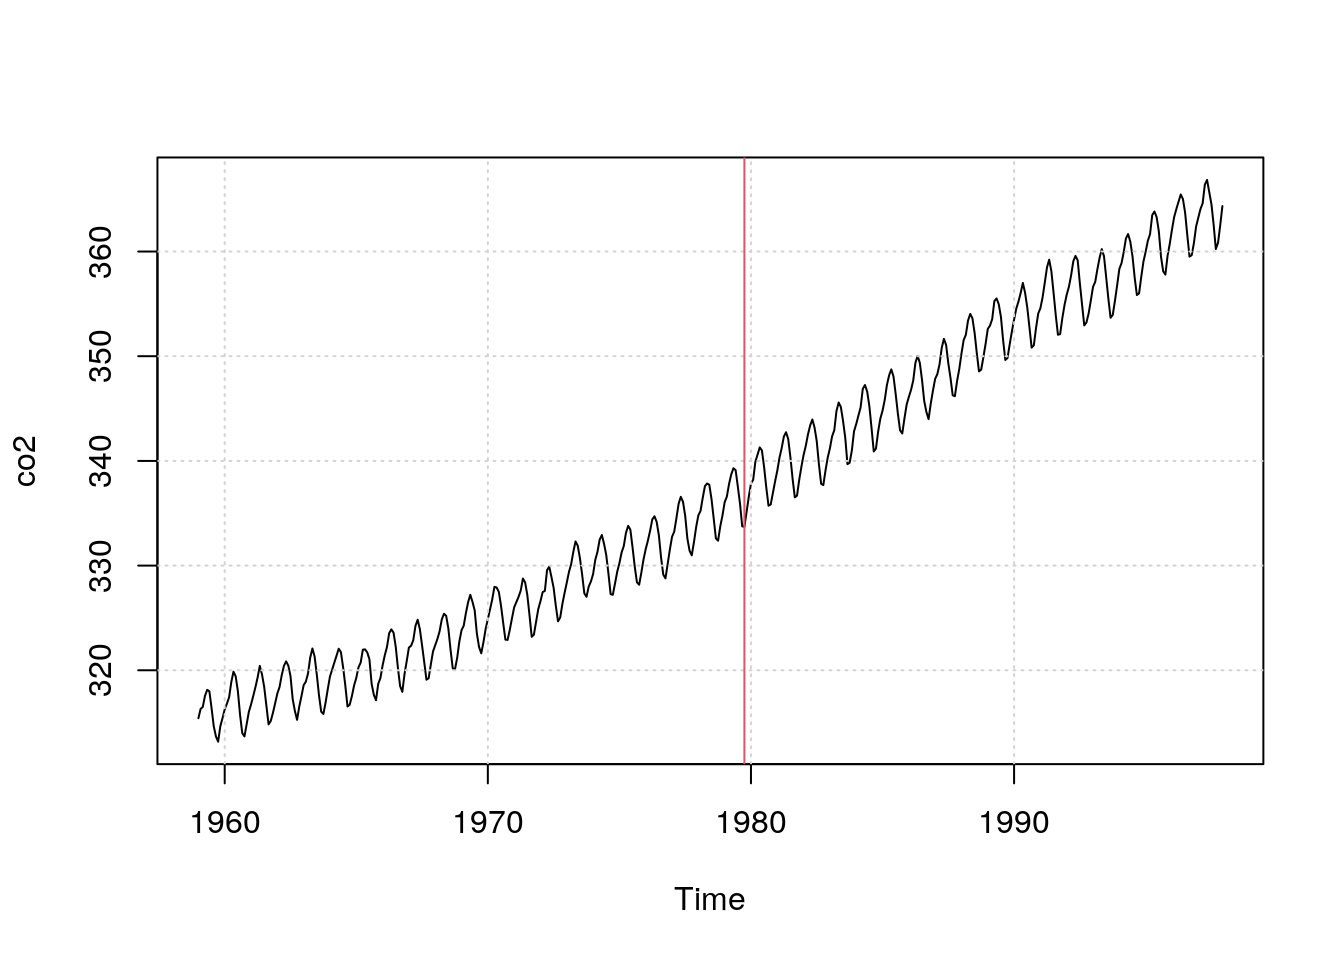
It occurs to me looking at that graph that perhaps the raw monthly value isn’t the right number to choose, since I was clearly born at a seasonal minimum of CO2 concentration (i.e. at the end of Northern Hemisphere summer, when lots of atmospheric CO2 was locked up in plants). So, first I’ll figure out the “raw” value, and then next we’ll smooth the series to get something that is more representative of the background CO2 concentration.
t <- time(co2)
II <- which(1979+9/12 <= t & t <= 1979+10/12)
clark_co2 <- co2[II]
plot(co2)
grid()
abline(v=1979+9/12, col=2)
abline(h=clark_co2, col=2)
text(par('usr')[2], clark_co2, paste0(format(clark_co2, digits=3), '          '), pos=3, offset=0.25)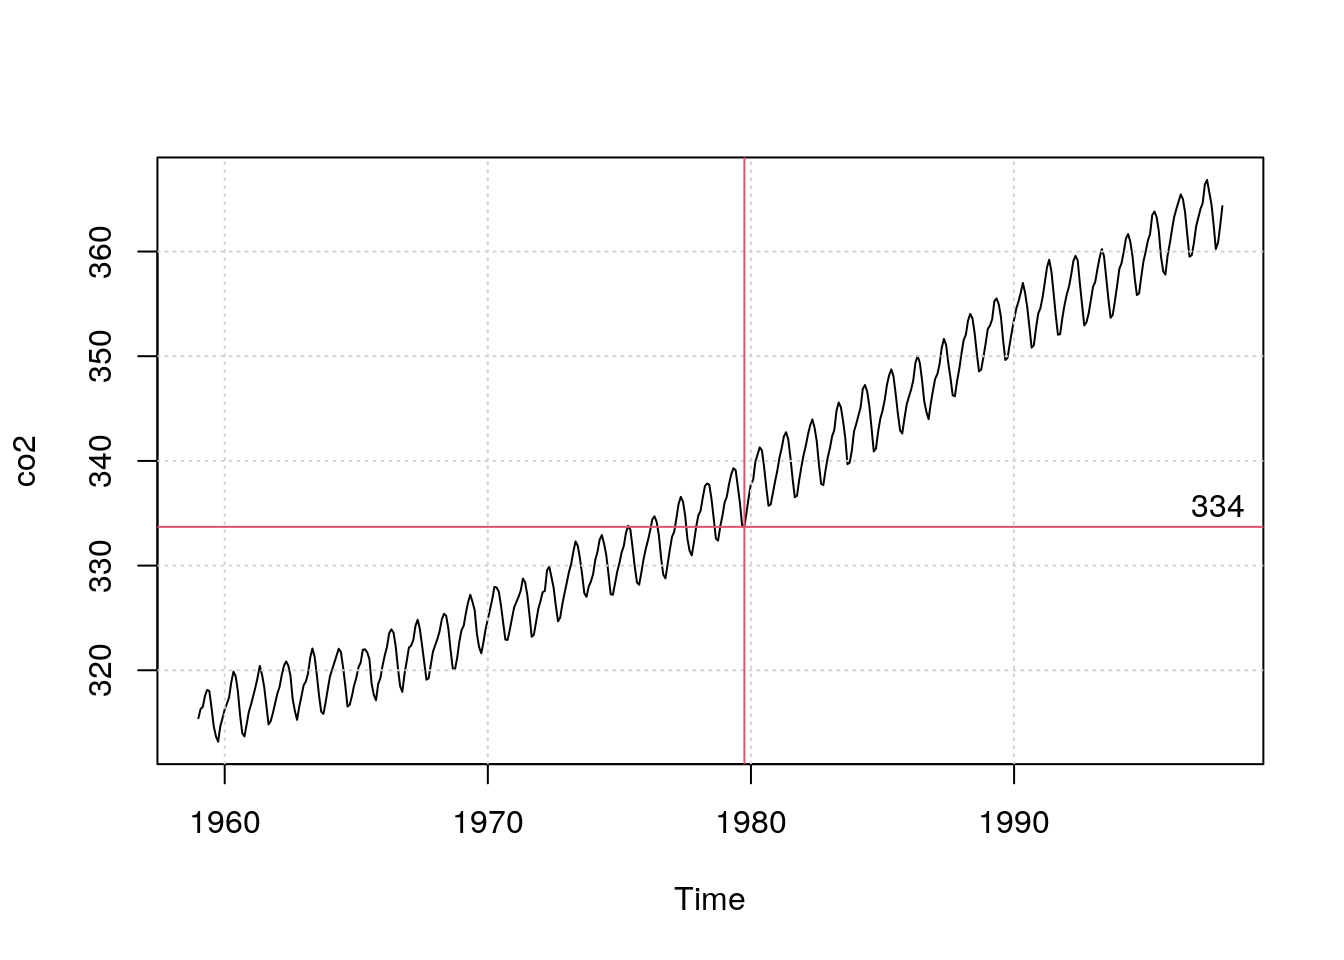
Concentration based on a smoothed time series
I love smoothing splines, so I’ll use that to smooth the co2 data before interpolating:
co2s <- smooth.spline(co2, df=30)
plot(co2)
lines(co2s, col=2, lwd=2)
grid()
abline(v=1979+9/12, col=2)
clark_co2 <- co2s$y[II]
abline(h=clark_co2, col=2)
text(par('usr')[2], clark_co2, paste0(format(clark_co2, digits=3), '          '), pos=3, offset=0.25)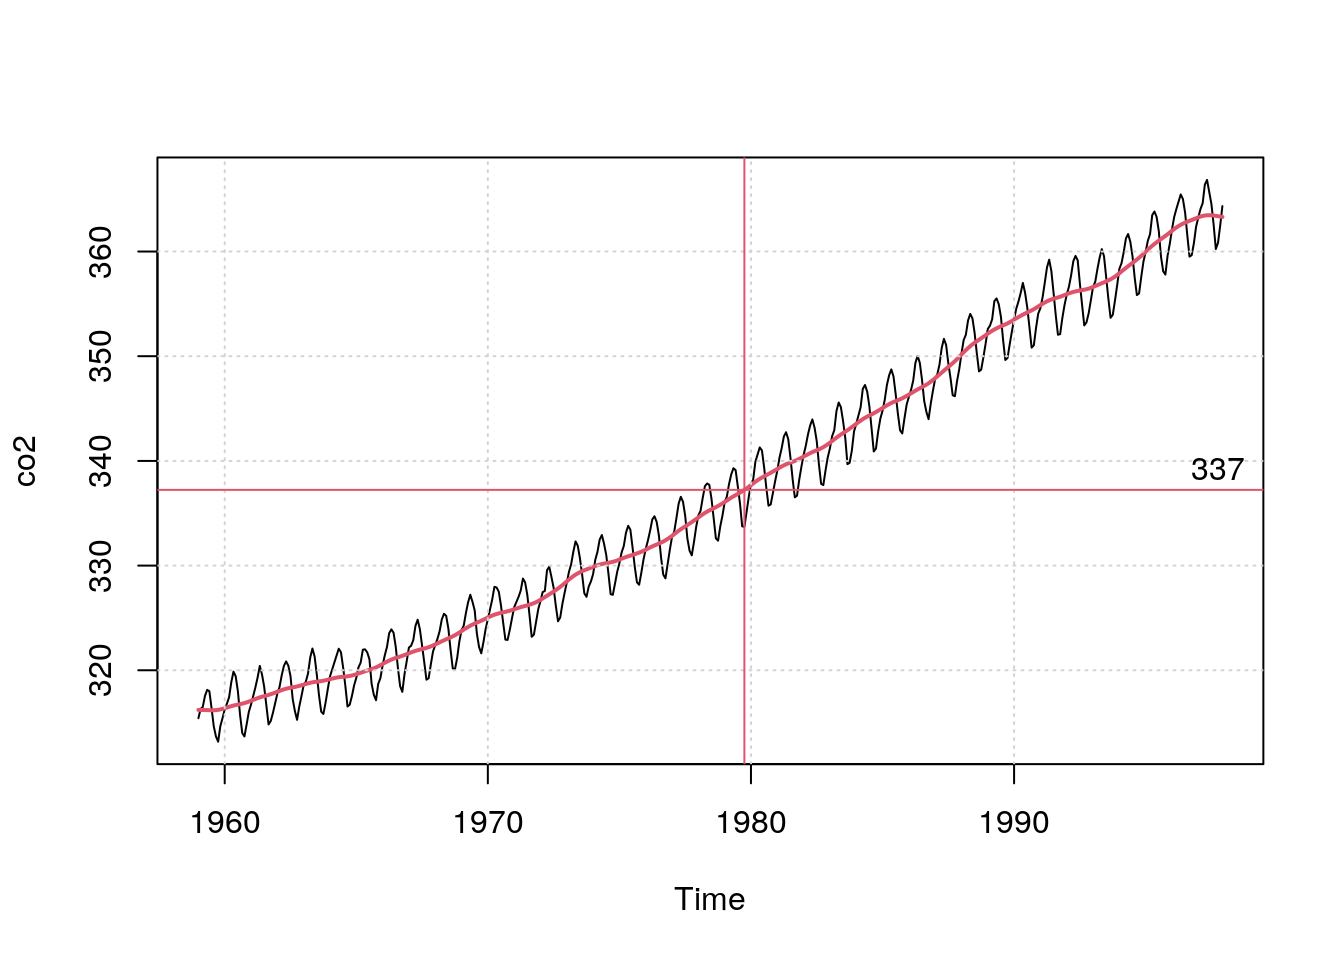
So, I was born at 337 ppm.